During the session we looked at the electromagnetic spectrum, forces and motion and radioactivity. Photos of the session will be posted on Flickr.
We used a hand held spectrometer to look at the visible spectrum from a variety of sources, these are good quality spectroscopes available from a variety of sources (e.g. Timstar) at about Ł70 each.

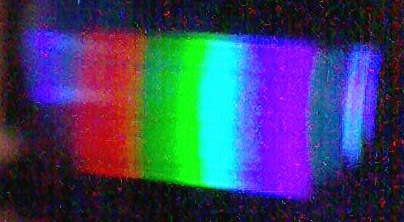
We also used hand held spectroscopes kits bought for about Ł4 each from MUTR who sell equipment produced by the Science Enhancement Project. The spectroscope used a DVD in a box; we decided we could make these out of cardboard boxes using the kit as pattern and getting the pupils to bring in an old DVD. We also thought it would be good to look at the performance of a BluRay disc as an alternative diffraction grating.
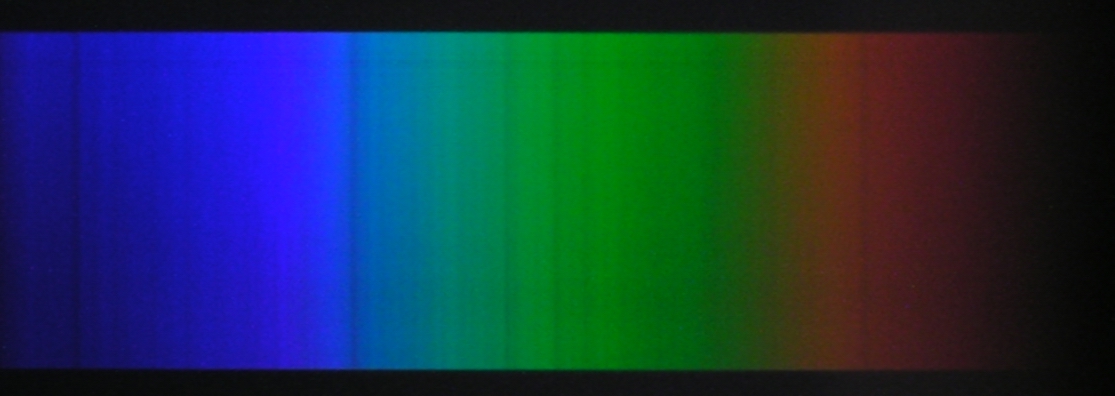
We started by pointing the slit at an incandescent light bulb and saw a complete spectrum.
We used a computer based Red Tide spectrometer from Ocean Optics to show the spectra of all of the above sources on the data projector and saw that the peaks in the spectrum of the helium gas discharge tube corresponded to some of the dark Fraunhoffer lines in the spectrum of the sun showing that there is helium in the atmosphere of the sun.
We used a UV light to show the flourescent inks in banknotes, tese are relatively inexpensive but the UV light needs to be of the correct wavelength of 365nm to make the ink in the note flouresce.
We used a simple circuit to detect infra-red light from the window, from a remote control and from an infra red LED. Using a mirror we showed that infra-red light has the same properties of reflection at a plane mirror as visible light.
A torch can be used to show the inverse square law. The power of the bulb can be found by looking at the writing on the side. Hold the torch in a retort stand and point it at some (squared) paper and measure the area of the beam either by counting squares or using π r2. The Intensity is calculated by dividing the power of the bulb by the area of light it makes. The light is more intense when the torch is close to the paper concentrating the power on a small area. A table showing distance, area and intensity can be constructed by taking measurements at different distances. Explained that the light from the torch consists of very many photons and these do not disappear on their journey to the screen but are spread out over the area of the beam. The experimental results should show that if the distance is doubled the height of the beam is doubled and the width of the beam is doubled so the area is 2 x 2 = 4 times as big. The inverse square law can then be explained.
A solar cell (photovoltaic cell) can be used to measure light intensity using an ammeter connected across the solar cell. The current is proportional to the light intensity on the solar cell. The room does not need to be dark just subdued light, if microscope lamps or desk lamps are used they can be pointed at the solar cell and not disturb other experimenters alternatively a card can be placed behind an unmounted bulb to minimise the stray light.
We analysed the forces acting on an object by sticking different coloured cardboard arrows to objects with blue tack. We saw the there was a net force when the forces did not add up to zero. This is useful prelude to force diagrams.
We looked at Newton's third law and the 'partner' forces and used cardboard arrows of the same colour to show the partner forces.
We produced distance-time graphs by walking with a distance sensor attached to a datalogger and tried to reproduce the shape of some distance-time graphs drawn on the board. There are a variety of datalogging systems suitable for this task, the ones we used are produced by Pasco.
We looked at crumple zones using two systems: datalogging forces and a spike sticking in plasticine on a figure fixed to the vehicle by a hinge. We constructed a number of different crumple zones and discovered that the ones that folded up over the greatest distance were best at reducing the force of impact. There are two ways of analysing this:
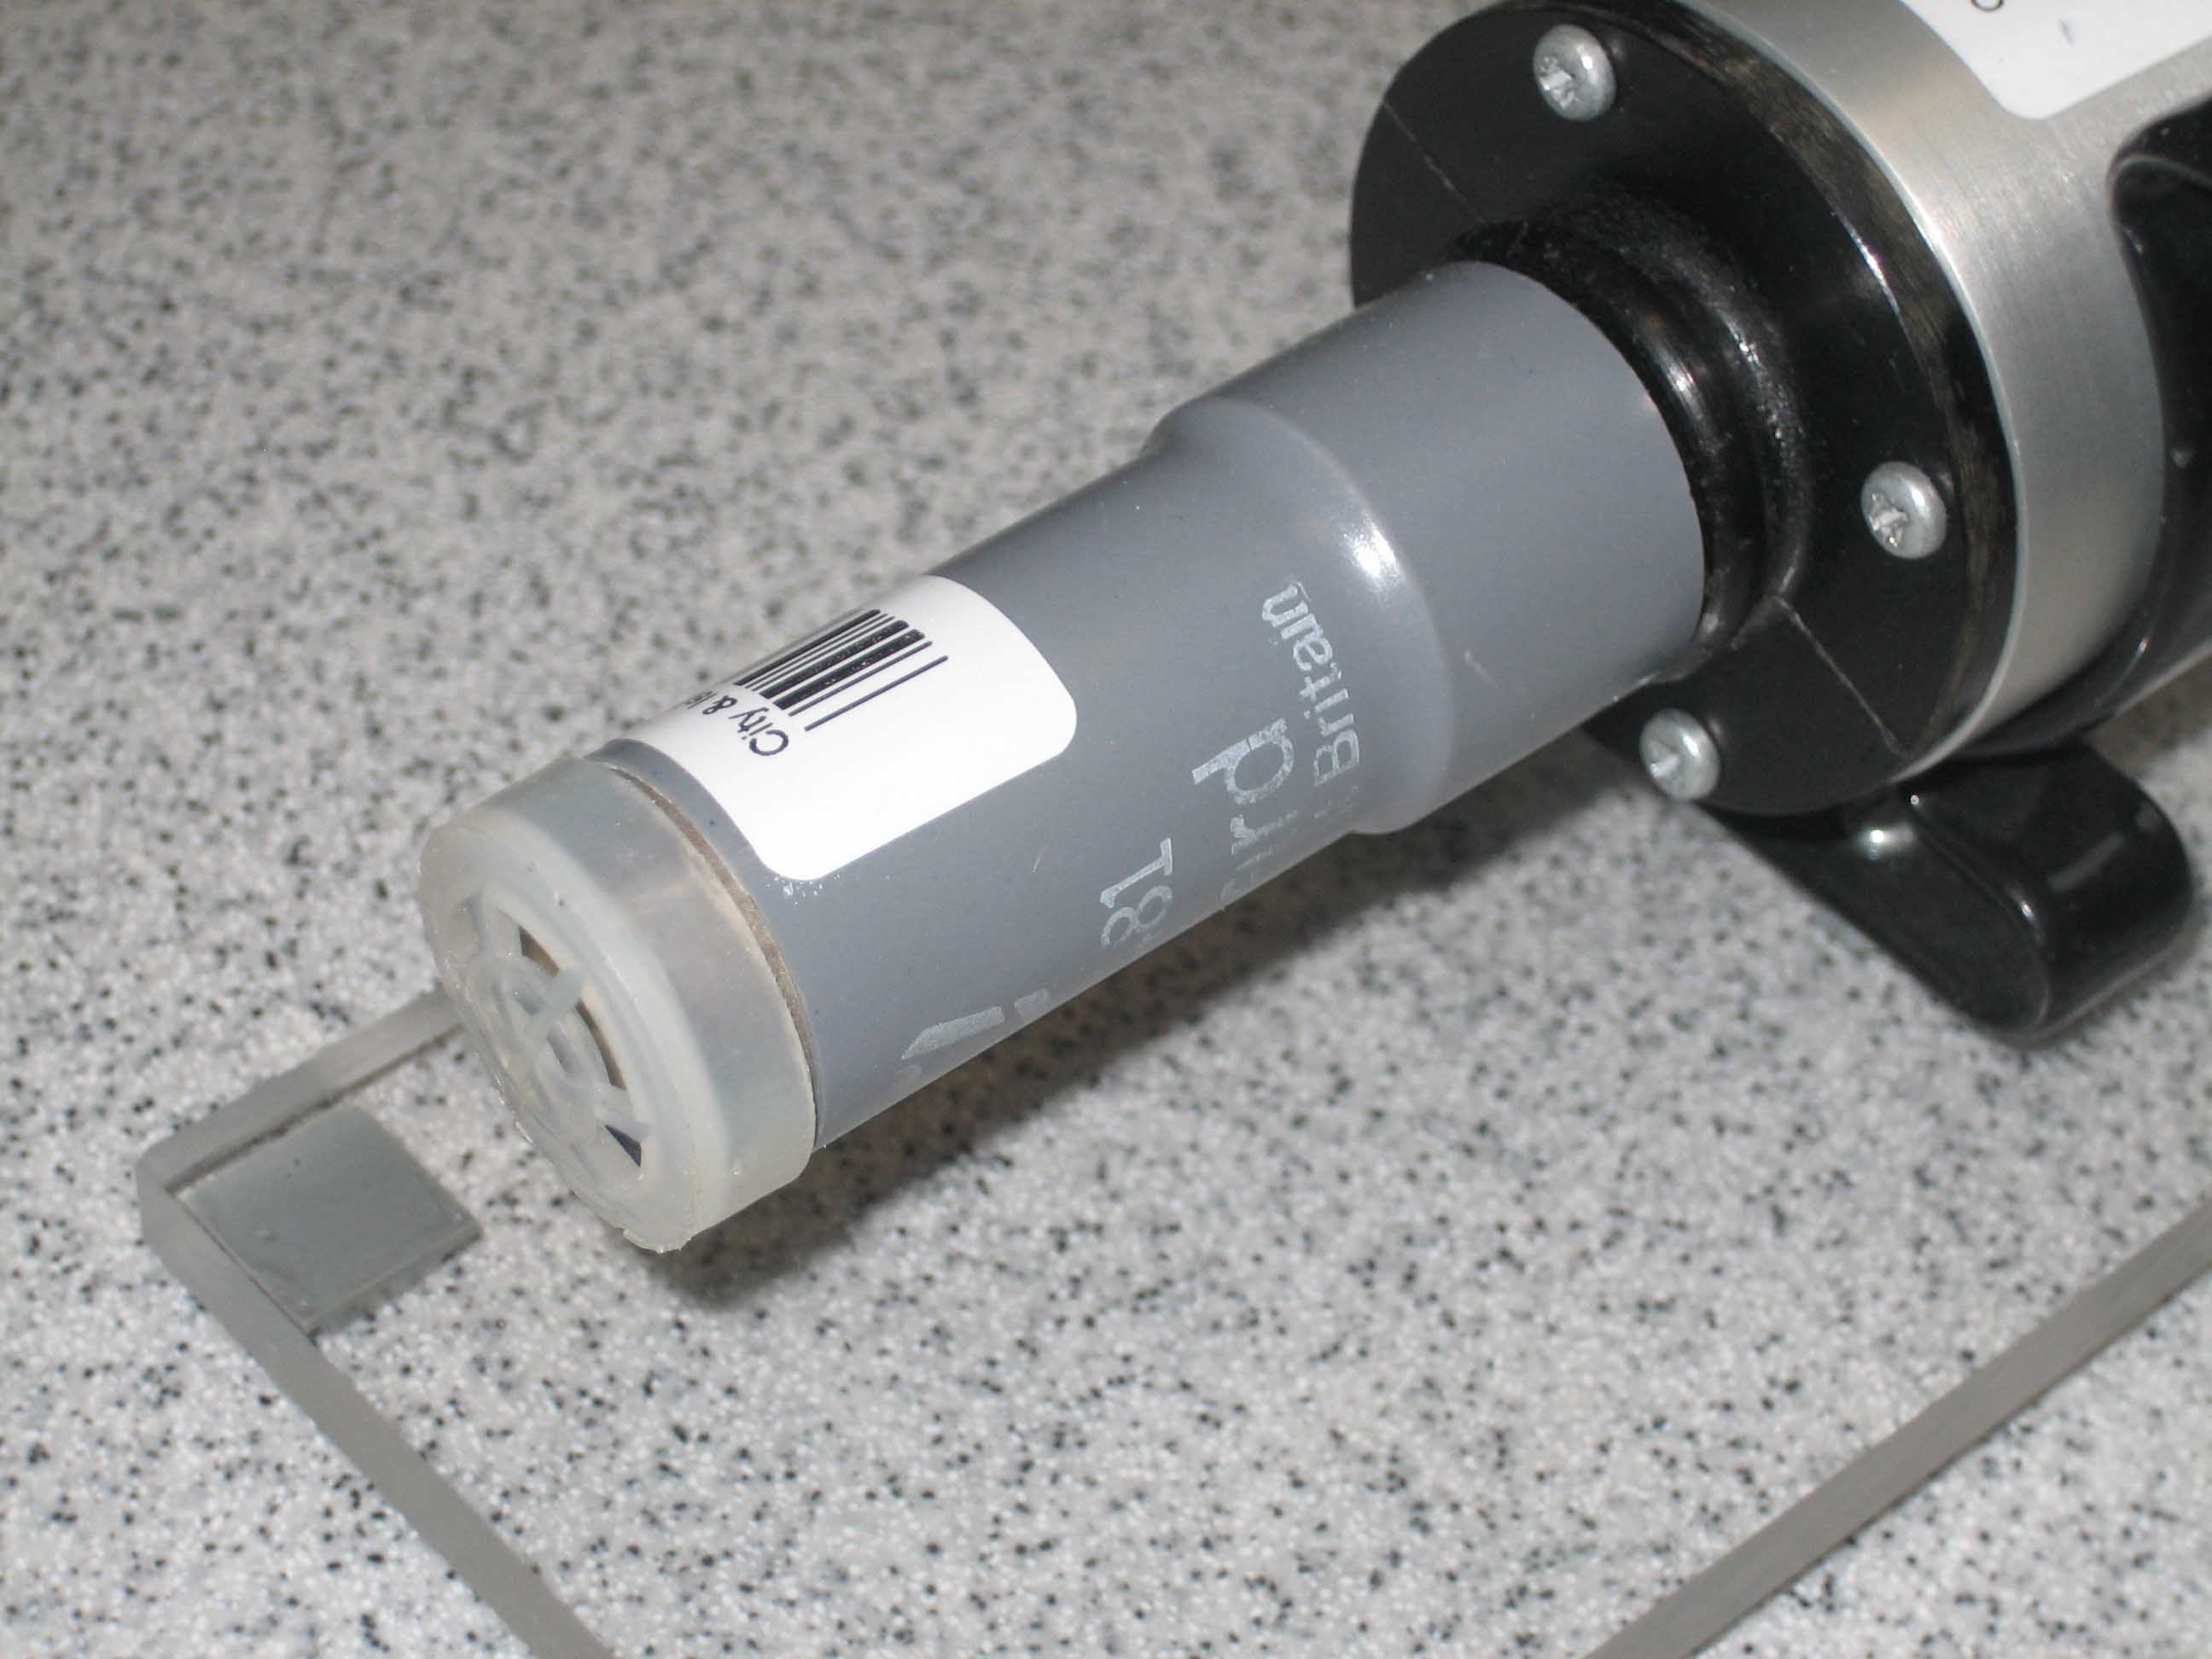
We used a GM tube and scalar timer to measure background radiation.
There are some sources of radiation which can be easilly obtained:
If you need any further information or help contact David Swinscoe.